Benefits of using Power BI and BIM in the design and execution phase
In BIM, how do we...
- approach decision-making in a constantly changing environment such as design and construction projects?
- provide certainty with BIM to those responsible for making decisions?
- communicate the information contained in our models in the clearest and simplest way? Can we rely only on drawings and tables?
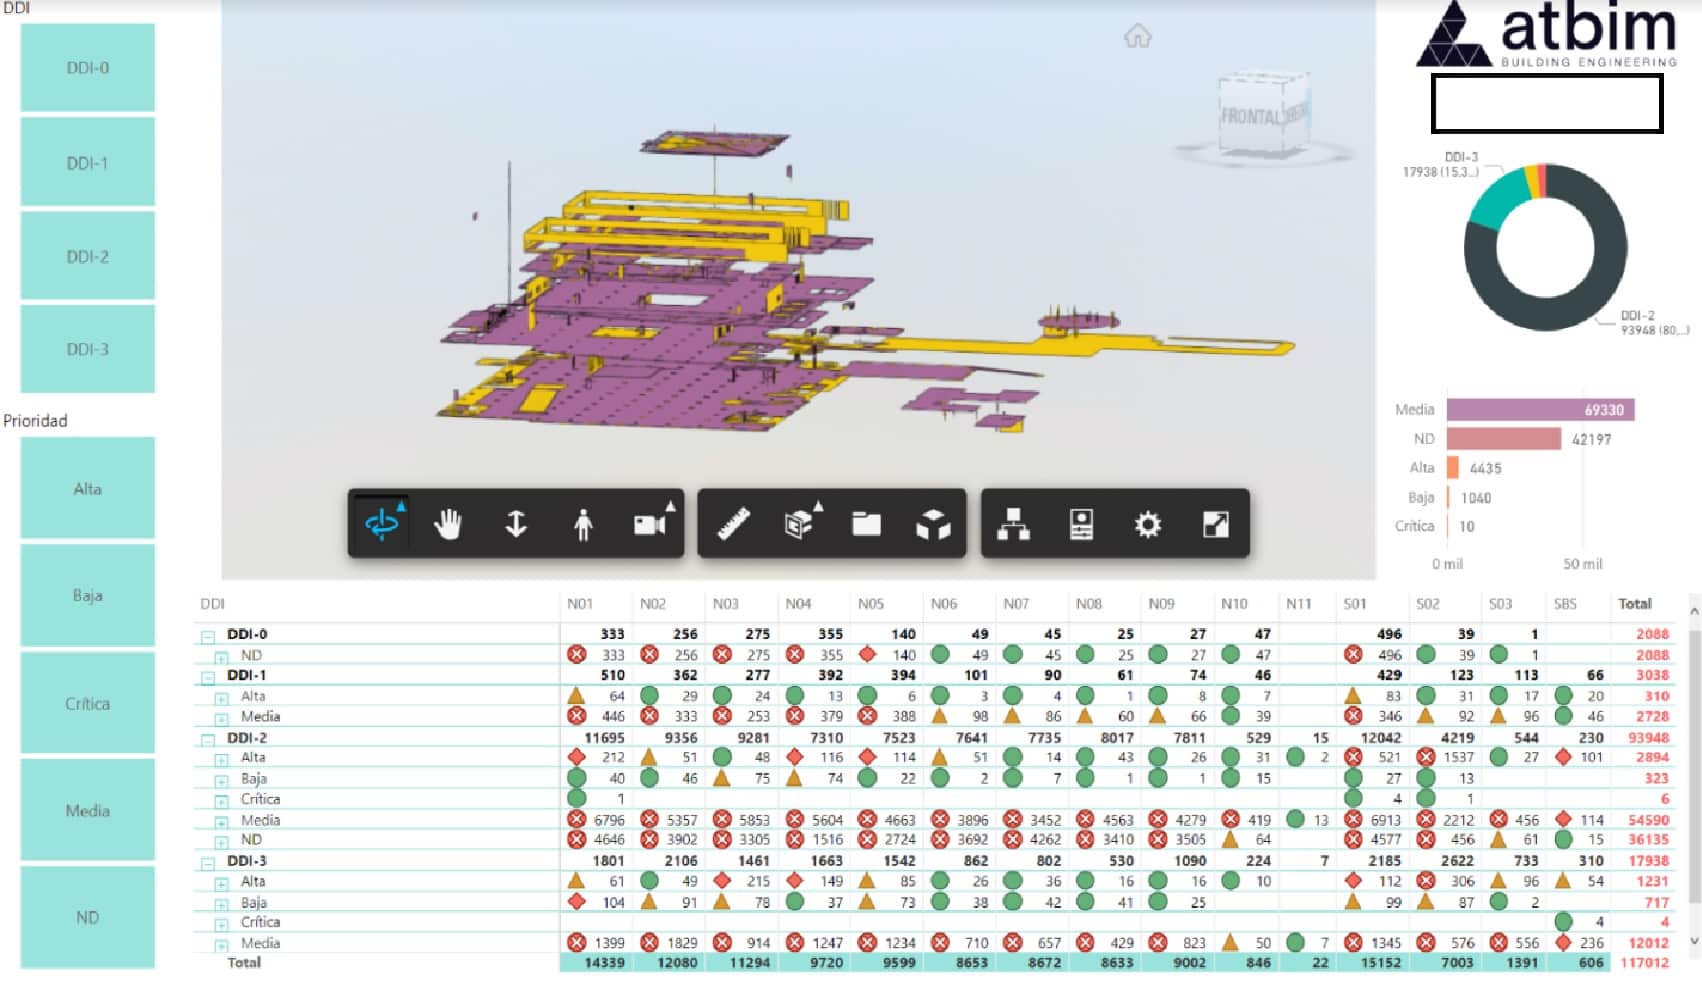
1. Real-time visualization:
By combining BIM with data analysis and visualization, significant opportunities are unlocked to improve decision-making, optimize efficiency, and deliver more successful projects. In this post, we explore how the combination of BIM tools and Power BI is used in our day-to-day work at ATBIM Building Engineering.
2. Detailed data analysis:
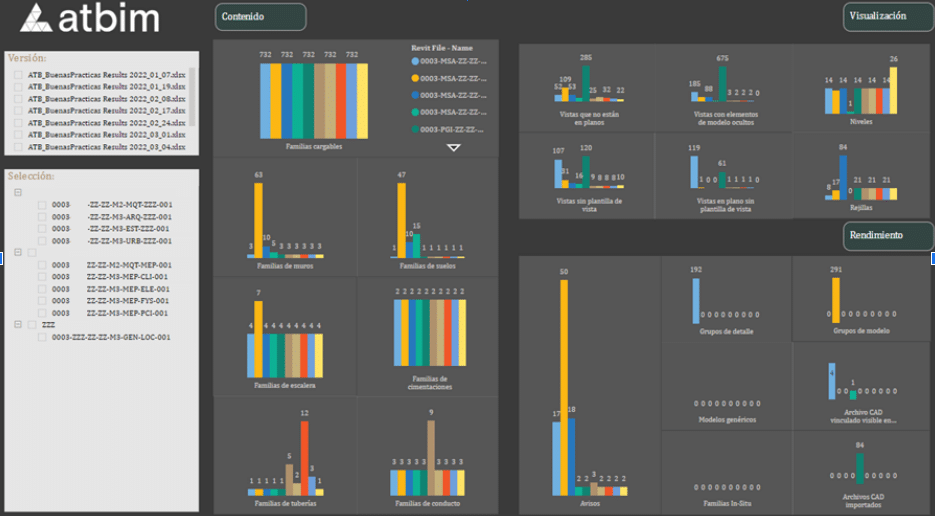
Data integration requires an initial quality analysis (organized, filtered, and classified...), and Power BI provides the capability to perform deeper and more detailed analysis. Users can investigate specific aspects such as material usage, parameters, phases, model organization, etc.
By analyzing this data holistically, it becomes possible to identify areas for improvement, optimize designs, and make data-driven decisions in real time to achieve optimal project performance.
3. Early conflict detection:
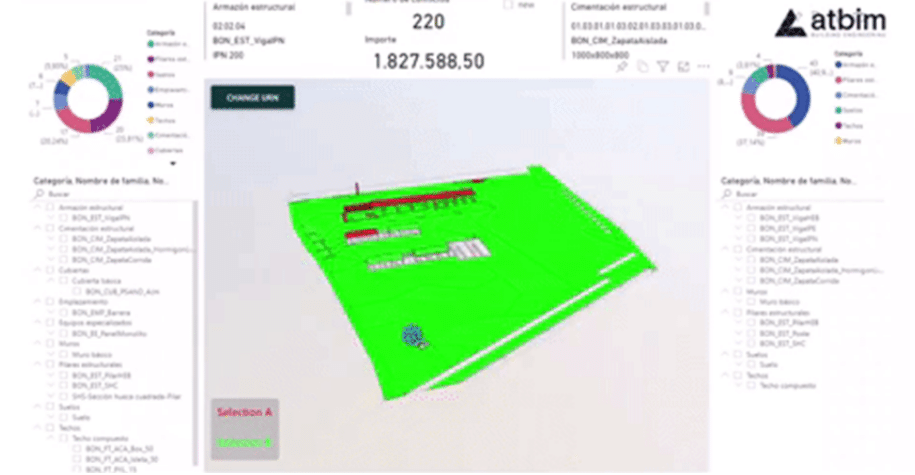
The BIM methodology is already well known for its ability to detect potential conflicts and issues during design and planning stages. However, creating visualizations in Power BI that highlight these conflicts allows teams to address problems before they become costly obstacles during construction.
What if we go one step further? What if we relate them to execution costs? What if we link them to spatial or zoning parameters?
Managing centralized information in Power BI has clear advantages: everything can be connected to the model without overloading it or relying on complex clash matrices that never fully satisfy everyone.
These developments proposed by ATBIM provide flexibility and allow each stakeholder to combine data as they wish according to their business needs.
 react + three.js = react-three-fiber
4. Progress and budget monitoring:
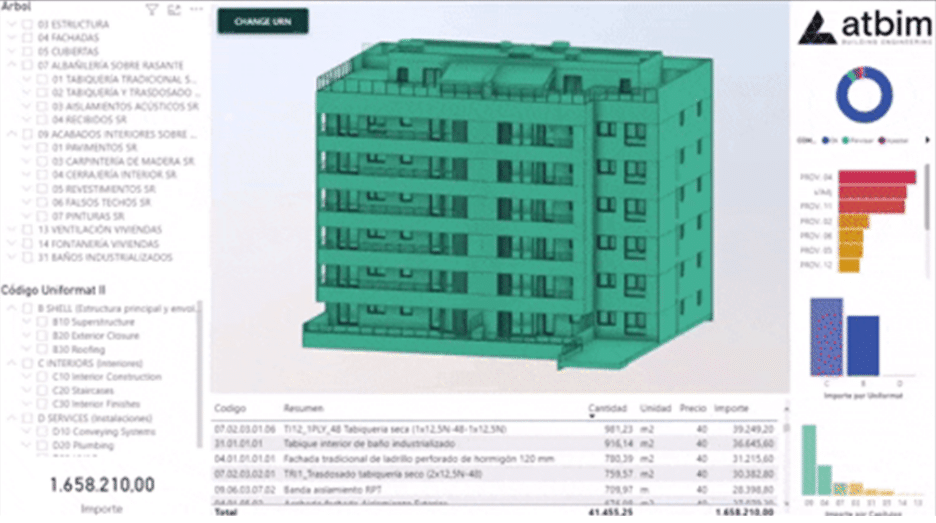
Tracking project progress and managing the budget are essential in the AECO sector. Power BI can take BIM-generated progress data and transform it into intuitive charts and dashboards. This allows project managers to monitor progress in real time, identify potential delays, and take corrective actions.
Beyond real time, something even more critical is monitoring budget changes and their impact. Do we keep copies of previous versions? Open and close files constantly?
A better approach is to maintain a versioned budget history within the same dashboard, allowing instant comparison of how the budget evolves with just a click.
 Ciclo de conversión de un modelo .rvt a gltfjsx
5. Effective communication:
These dashboards facilitate communication between stakeholders by transforming complex data into accessible information for all parties involved.
In the AECO sector, most problems stem from communication. Improving communication means improving the project. These reports and visualizations enhance this process because they can be shared with clients, contractors, and other stakeholders.
This leads to better mutual understanding, reduces misunderstandings, and results in smoother collaboration and more successful outcomes.
Once these dashboards are implemented and adopted, it’s time to let the data speak for itself. A picture is worth a thousand words (or emails).
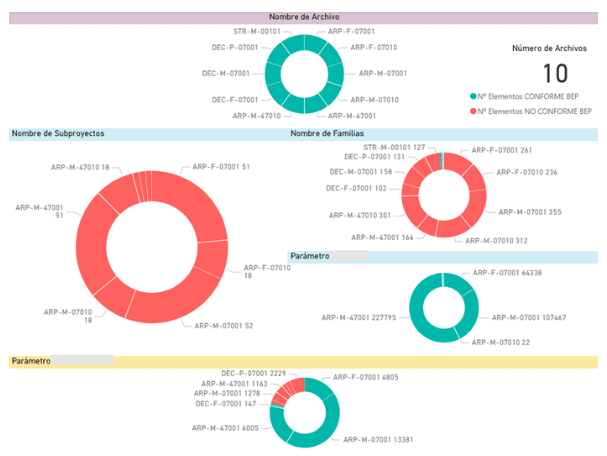
In summary, this combination of information-based tools and technologies (Power BI and BIM methodology) allows us to maximize the potential of data generated by all stakeholders in a project, saving time and money while improving decision-making.
At ATBIM, we can deliver more efficient, profitable, and ultimately more successful projects. Do you believe it, or are you our next challenge?
"Information is the currency of the 21st century, and those who do not control it will be at a disadvantage." - Peter Sondergaard